The question
Which NYC buildings, especially homes likely to have basement units, face rainfall flood risk but sit outside FEMA's flood zones?
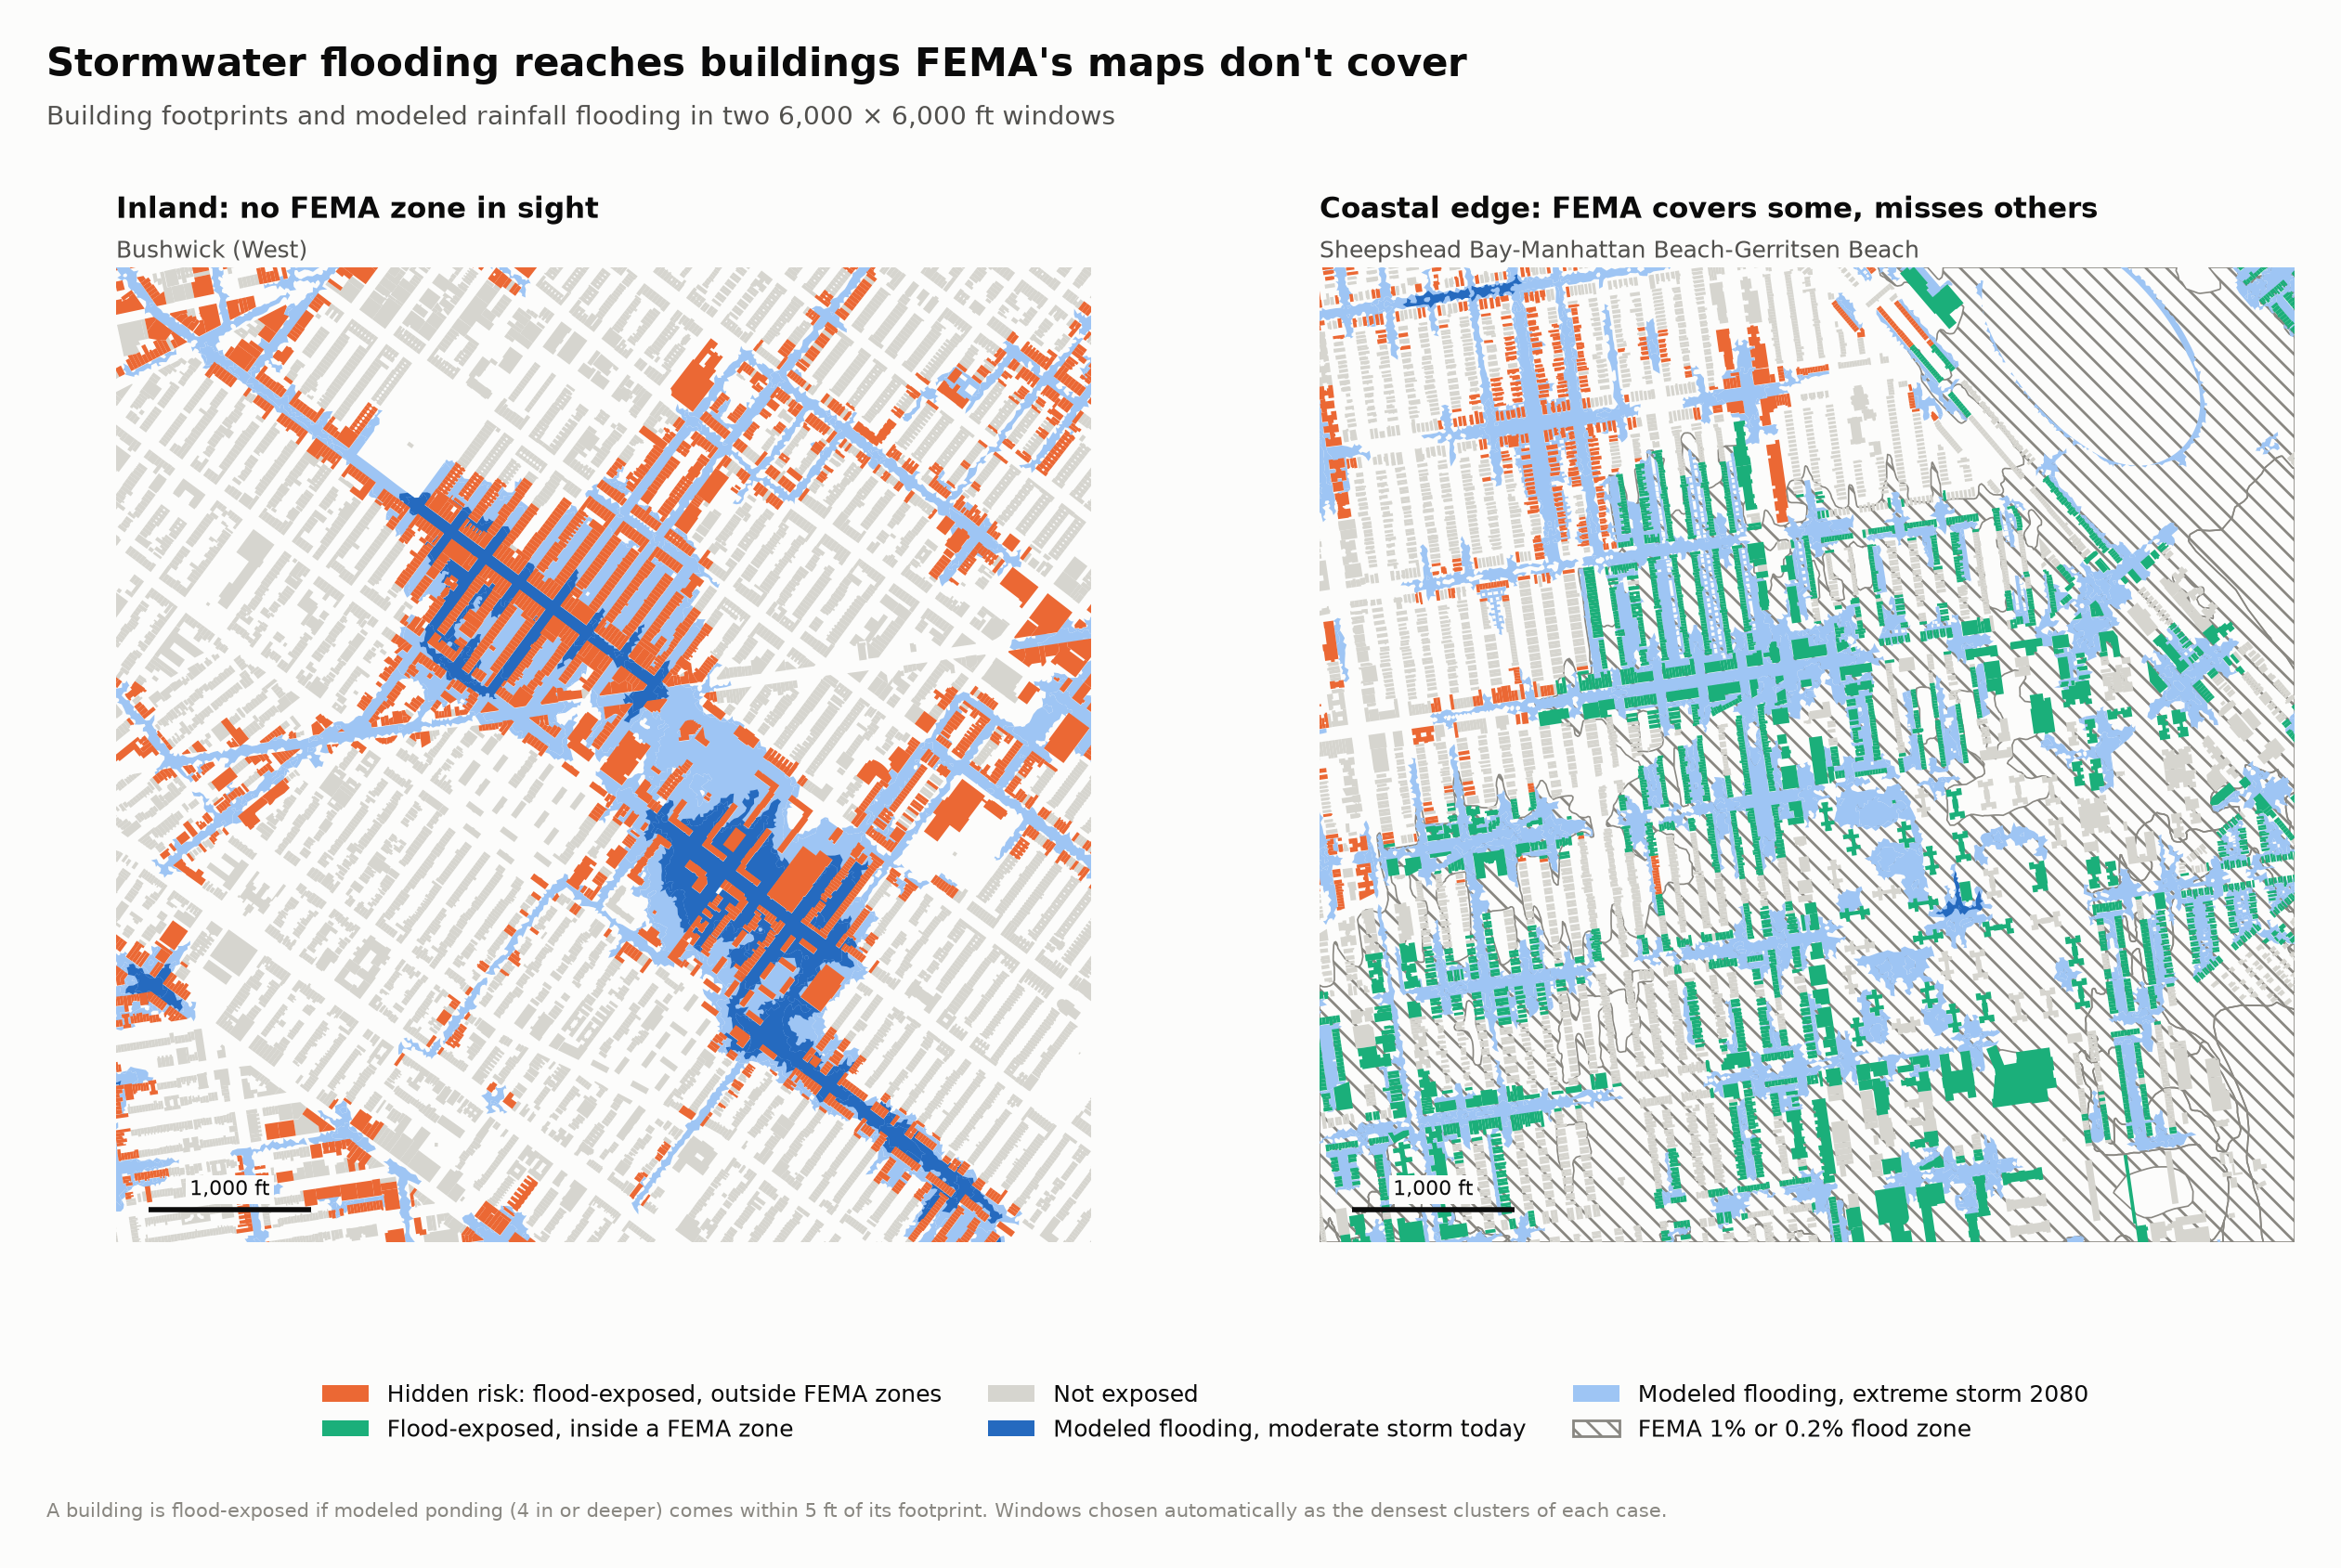
FEMA's flood maps decide where flood insurance is required, and in New York City they mainly cover coastal flooding: storm surge and high tides, as in Hurricane Sandy. They don't model rainfall flooding, which happens when an intense storm overwhelms the sewers and water collects in low streets, yards and basements.
That gap turned deadly during Hurricane Ida on September 1, 2021, when more than three inches of rain fell in an hour. Thirteen New Yorkers died, eleven of them in basement apartments, in neighborhoods FEMA's maps mostly treat as low-risk. This map finds the buildings in that gap.
Key findings
Most rainfall flood risk in the city is outside FEMA's maps. Of the – buildings near modeled rainfall flooding in any scenario, – are outside both FEMA flood zones. Queens and Brooklyn hold about three-quarters of them, and southeast Queens around St. Albans and Baisley Park has the most likely basement homes at hidden risk.
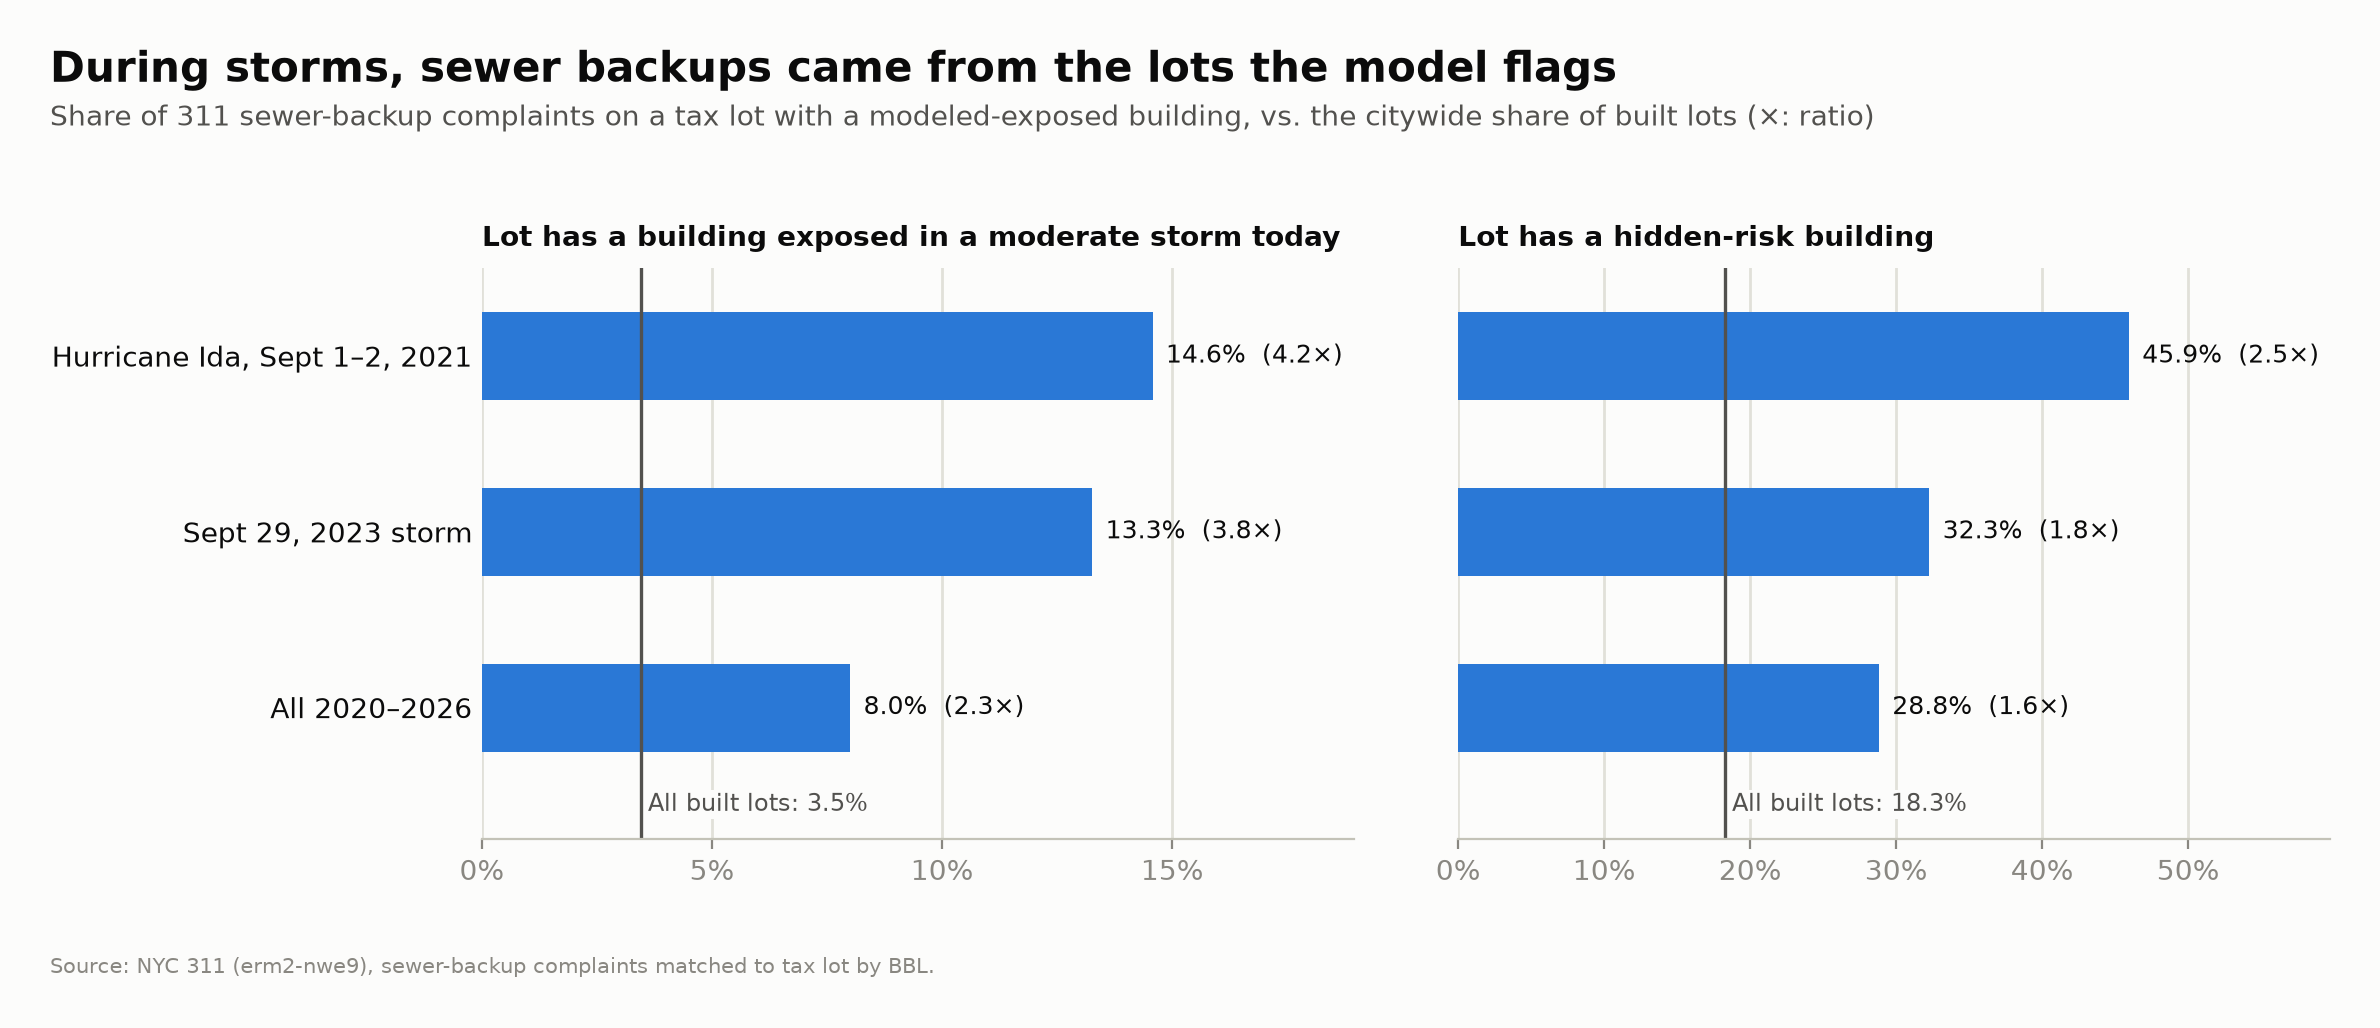
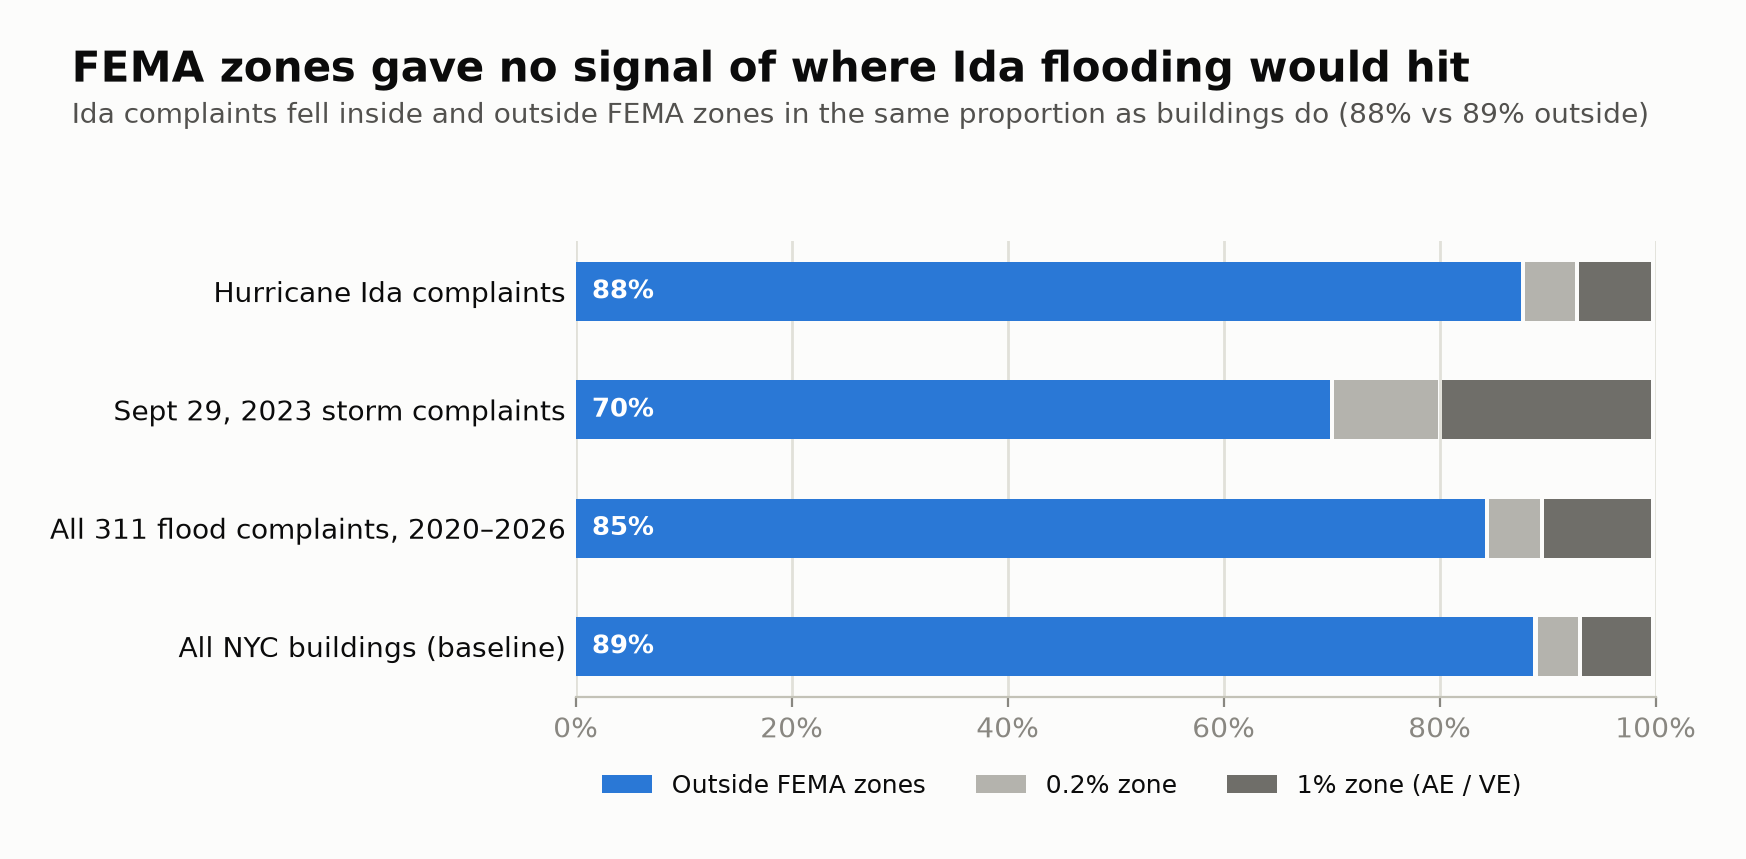
The stormwater model also lines up with what really happened. During Ida, 311 sewer-backup complaints were – more likely than chance to come from a tax lot the model flags as exposed today. FEMA zones didn't predict anything. Ida complaints fell inside and outside them in the same proportion as buildings in general.
Using the map
The map has two levels of detail. When zoomed out, it shades neighborhoods. Zoom past street level (roughly zoom 14, where individual blocks fill the screen) and it switches to individual buildings.
The side panel
- Address search
- Type any NYC address. See Searching an address.
- Headline numbers
- Citywide totals: hidden-risk buildings, how many of them flood in a moderate storm today, likely basement homes at hidden risk, and the Ida validation result.
- Neighborhood shading
- Choose what the neighborhood colors show:
- Hidden-risk share of buildings: the percent of a neighborhood's buildings at hidden risk in any storm scenario.
- Hidden-risk buildings, moderate storm today: a count, using only today's moderate-storm map.
- Likely basement homes at hidden risk: a count of 1–2 family homes with below-grade basements at hidden risk.
- Ida 311 flood complaints per 1,000 buildings: what actually got reported during Ida.
- Buildings
- The color key for footprints (see Reading the colors). Show only likely basement homes hides every building except 1–2 family homes with a confirmed below-grade basement.
- Layers
- Turn the flood layers on and off: modeled flooding for a moderate storm today (dark blue), for an extreme storm in 2080 (light blue), FEMA flood zones (gray hatching), and 311 flood complaints (black dots) for Hurricane Ida, the September 29, 2023 storm, or all of 2020–2026.
- Top neighborhoods
- The ten highest neighborhoods for the shading you chose. Click a name to zoom to it. The table is also a text version of the map's shading.
On the map
When you're zoomed out, click a neighborhood to see its totals. Once you're zoomed in, click a building to see its address, building class, year built, basement type, FEMA zone, and flood status in each storm scenario.
The page address updates as you move around, so you can copy it to send someone the exact view you're looking at. On a phone the panel sits at the bottom of the screen, and you can tap to collapse it.
Searching an address
Type at least three characters of an NYC address into the search box at the top of the panel, for example 1474 Myrtle Ave, then pick a match with the mouse or the arrow keys and Enter. The map zooms to the address, outlines the building in black, and opens its details.
Search uses NYC Planning Labs' GeoSearch service, which is built on the city's official address database (PAD). It returns the building's BIN (Building Identification Number), which the map uses to find the exact footprint. If an address has no BIN match (for example, a vacant lot), the map uses the footprint nearest the geocoded point.
What you type is sent to GeoSearch, an NYC Department of City Planning service. The background map loads from OpenFreeMap and the map software from the unpkg CDN. All of the project's own data loads from this site.
Reading the colors
Buildings
- Hidden risk, today. Modeled flooding in a moderate storm under today's conditions reaches within 5 ft of the building, and the building is outside FEMA's 1% and 0.2% flood zones.
- Hidden risk, future storms only. Outside FEMA zones, and exposed only in the 2050 or 2080 scenarios.
- Flood-exposed, inside a FEMA zone. Exposed to rainfall flooding, but already inside a FEMA zone, so the risk is "on the map."
- Not exposed. No modeled rainfall flooding within 5 ft in any scenario. These buildings can still flood. The model just doesn't predict it.
Flood layers
- Moderate storm today: where DEP's model shows 4 in or more of standing water in a 2.13 in/hr storm at today's sea level.
- Extreme storm 2080: the same for a 3.66 in/hr storm with 2080 sea levels. It covers much more ground.
- FEMA flood zone: the 1% (VE, AE, A, AO) and 0.2% zones from FEMA's 2015 Preliminary flood map.
- 311 complaint: one street-flooding, sewer-backup or catch-basin complaint.
Modeled flooding appears in streets and yards but never on top of buildings. That's how the city drew it: building footprints are cut out of the flood areas. It's also why the map measures exposure at the building's edge (see How I calculated it).
The data
Everything comes from public sources. Before combining anything I converted every layer to the same coordinate system, NY State Plane Long Island zone in feet (EPSG:2263).
| Dataset | Publisher | What it is | How it's used |
|---|---|---|---|
| Building Footprints NYC Open Data 5zhs-2jue, Oct 2026 | NYC Office of Technology & Innovation | Outlines of 1,082,964 structures, with BIN, BBL, height and construction year. | The unit of analysis. 868,893 buildings after removing garages, sheds and other minor structures. |
| MapPLUTO 26v2 NYC Dept of City Planning | DCP | One record per tax lot (856,687) with building class, year built, floors, units and basement type. | Joined to buildings by tax lot (BBL) to get building class and basement type. – of buildings matched. |
| NYC Stormwater Flood Maps NYC Open Data, 2021 | NYC Dept of Environmental Protection | Computer-modeled rainfall flooding for several storm scenarios, in two depth classes. | Decides which buildings are exposed to rainfall flooding. |
| 2015 Preliminary FIRM FEMA flood hazard areas (S_FLD_HAZ_AR) | FEMA, republished by NYC Dept of Design & Construction | Flood zone polygons: VE, AE, A, AO, 0.2%, X. | Decides which buildings are in a FEMA flood zone. |
| 311 Service Requests NYC Open Data erm2-nwe9 | NYC 311 | – geocoded flood-related complaints, Jan 2020–Oct 2026. | Real-world check on the model. |
| 2020 Neighborhood Tabulation Areas NYC Open Data 9nt8-h7nd | DCP | 262 neighborhood boundaries built from 2020 census tracts. | Neighborhood totals and the map's shading. |
| 2020 Census Tracts NYC Open Data 63ge-mke6 | DCP / US Census | 2,325 tract boundaries. | Assigning buildings and complaints to neighborhoods, and the tract-level validation. |
Storm scenarios
| Scenario | Rainfall | Sea level | Buildings exposed |
|---|---|---|---|
| Moderate storm, today | 2.13 in/hr | Current | – |
| Moderate storm, 2050 | 2.13 in/hr | 2050 projection | – |
| Extreme storm, 2080 | 3.66 in/hr | 2080 projection | – |
For scale, Ida's peak hour brought 3.15 in at Central Park, close to the "extreme" scenario. DEP also published a "limited" 1.77 in/hr map, but it uses a compressed Esri format that open-source tools can't read, so it isn't included.
How I calculated it
First I put every dataset into NY State Plane (feet), repaired the invalid shapes, and stored tax-lot IDs the same way everywhere as 10-digit text. Each building footprint carries the ID of its billing tax lot, which links it to its building class and basement type in MapPLUTO. Condo buildings only match if you use the billing lot and not the unit lot. Joining on the unit lot would lose about 2% of the city's footprints.
A building counts as inside a FEMA zone if any part of its footprint touches the zone, which is the same rule FEMA uses. If it touches more than one, the most severe zone wins (VE, then AE, then 0.2%).
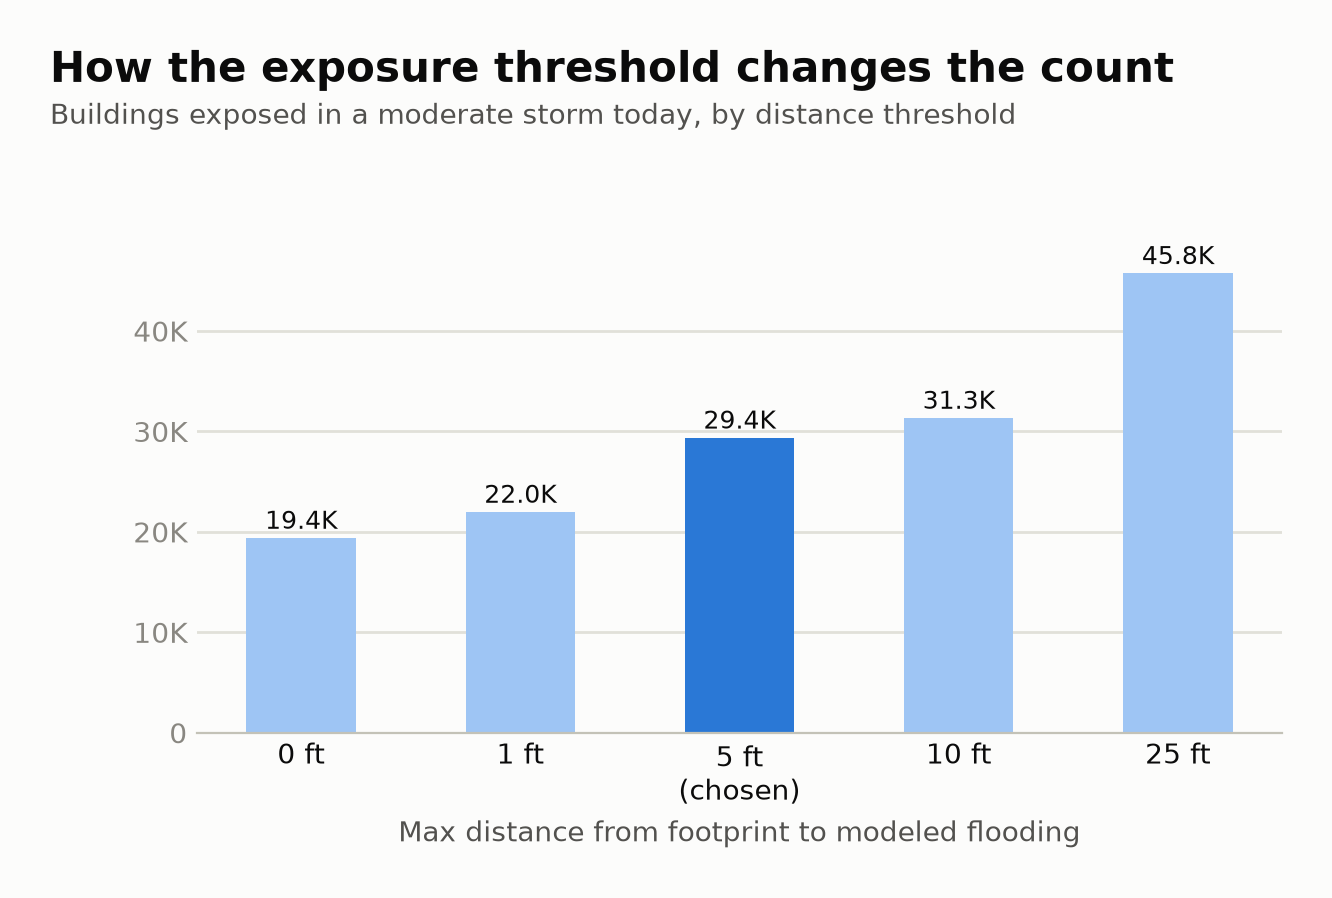
Rainfall exposure was the tricky part. The city's flood polygons have building footprints cut out of them, so testing a point inside each building finds almost nothing. Instead I measure the distance from each footprint's edge to the nearest modeled flood area and count a building as exposed if water comes within 5 ft. I left out the "future high tide" category in the 2050 and 2080 maps because it's coastal flooding, not rain.
From there, hidden risk means exposed in any scenario and outside FEMA's 1% and 0.2% zones, and a likely basement home is a 1–2 family home with a below-grade basement on record. The neighborhood and borough numbers are straight counts, plus 311 complaints per 1,000 buildings.
Why 5 feet?
The cut-out building shapes don't line up perfectly with the footprint layer, which leaves gaps of a foot or two. Five feet closes those gaps without reaching across a street. The chart shows how the count for a moderate storm today changes with the threshold:
Checking it against 311
The stormwater maps come from a model, so I checked them against 311 flood complaints to see whether they match real flooding. Two storms matter most. Hurricane Ida on Sept 1–2, 2021 produced – complaints, and the record rainfall of Sept 29, 2023 produced –.
The fairest test uses sewer-backup complaints, because they're reported at the home's address. For each one, the question is: does that tax lot hold a building the model flags as exposed? Across the city, – of built lots do. During Ida, – of sewer-backup complaints came from such lots, – the rate you'd expect by chance.
FEMA zones gave no such signal. Ida complaints fell inside and outside FEMA zones in about the same proportion as buildings in general:
At the neighborhood level the relationship is weaker. The rank correlation between a tract's exposed share and its complaint rate is about 0.2. That's expected: 311 rates also depend on who reports problems, and on the condition of local sewers and catch basins.
Glossary
- FEMA
- The Federal Emergency Management Agency. It runs the National Flood Insurance Program and publishes the flood maps that set insurance requirements.
- FIRM (Flood Insurance Rate Map)
- FEMA's official flood map for a community. NYC's effective FIRM dates from 2007.
- Preliminary FIRM (2015)
- The updated map FEMA drew after Hurricane Sandy. It's larger and more current than the 2007 map, but it never took legal effect: the city appealed it, and FEMA agreed to produce new maps. The city uses it for planning, and so does this project. Because it's larger than the 2007 map, it makes the hidden-risk count conservative.
- VE zone
- 1% annual chance of flooding plus waves 3 ft or higher. The most dangerous coastal zone, found on ocean-facing shores.
- AE zone
- 1% annual chance of flooding without large waves, with a mapped base flood elevation (the expected water height).
- A / AO zones
- Also 1% annual chance. "A" is mapped in less detail, and "AO" means shallow flooding (1–3 ft). This project groups them with AE.
- 0.2% zone (shaded X)
- 0.2% annual chance of flooding, often called the "500-year floodplain." Insurance isn't required.
- X zone (unshaded)
- Minimal flood hazard on FEMA's map. Most of NYC. Rainfall flooding can still happen here. FEMA's map just doesn't model it.
- Special Flood Hazard Area (SFHA) / "100-year floodplain"
- All the 1% zones together. A building here with a federally backed mortgage must carry flood insurance. A 1% yearly chance adds up to roughly a 26% chance over a 30-year mortgage.
- Annual chance
- The probability of a flood that large in any single year. "1%" doesn't mean once a century. It can happen in back-to-back years.
- Stormwater Flood Maps
- NYC DEP's 2021 computer model of where heavy rain overwhelms the drainage system. It shows areas of at least a quarter acre with 4 in or more of standing water. It covers public areas from rain only, not coastal surge, and doesn't model clogged drains or private plumbing.
- Nuisance flooding
- Modeled standing water 4 in to 1 ft deep. Enough to block streets and seep into low entrances.
- Deep and contiguous flooding
- Modeled standing water 1 ft or deeper over a connected area. Enough to pour into basements.
- Future high tides
- A third category in the 2050 and 2080 stormwater maps showing tidal flooding from sea level rise. It's coastal, not rainfall, so this project leaves it out.
- Sea level rise (SLR) scenario
- Higher seas make it harder for sewers to drain into the harbor, so the 2050 and 2080 stormwater maps assume projected future sea levels.
- Flood-exposed
- This project's term: modeled rainfall flooding (4 in or deeper) comes within 5 ft of the building's footprint.
- Flood-exposed in any storm scenario and outside both FEMA's 1% and 0.2% zones. A looser version, outside only the 1% zone, counts – buildings.
- Hidden risk today
- Hidden risk using only the moderate-storm, current-sea-level map: the most immediate risk.
- Likely basement home
- A 1–2 family home (building class A or B) that NYC's Department of Finance records as having a below-grade basement. It's a proxy: no public dataset lists basement apartments, legal or not. Most homes flagged this way don't have a basement unit, but basement units are most common in these buildings. A broader version also counts homes whose basement type is unknown (– at hidden risk, vs. – strict).
- Basement type (BsmtCode)
- The Department of Finance's basement code. A basement is either none, above-grade (walls at least 4 ft above ground on two sides), below-grade (walls mostly underground), or unknown, and the above- and below-grade types come in full or partial. "Full" means 75% or more of the first floor's area. DOF only verifies it for 1–3 family homes.
- Building class
- The Department of Finance's two-character use code. Class A is one-family homes and class B is two-family homes. C is walk-up apartments, D is elevator apartments, K is stores, and so on.
- BBL
- Borough-Block-Lot, the 10-digit ID of a tax lot (1 digit borough, 5 digits block, 4 digits lot). Condo buildings have a "billing" BBL (lot 75xx) for the whole building.
- BIN
- Building Identification Number, a 7-digit ID for each building. Address search uses it to find the right footprint.
- MapPLUTO
- DCP's Primary Land Use Tax Lot Output: one record per tax lot with dozens of attributes, joined to lot boundaries.
- Building footprint
- The outline of a building's roof as traced from aerial photography.
- NTA (Neighborhood Tabulation Area)
- DCP's 262 statistical neighborhoods, built from 2020 census tracts. The map's "neighborhoods" are NTAs.
- Census tract
- A small Census Bureau area, typically 1,200–8,000 people. Used here to assign buildings to neighborhoods and to compare complaint rates.
- 311 flood complaints
- Calls and app reports to NYC 311 about sewer backups (sewage coming up through drains, usually into basements), catch basins (clogged or flooding storm drains), street flooding and highway flooding. In 2026 the city renamed these from "Sewer" to "Sewer Maintenance", and both names are included.
- Lift
- How many times more often something happens than chance would predict. A lift of 4.2× means complaints came from flagged lots 4.2 times as often as flagged lots' share of the city would suggest.
- Rank correlation (Spearman's ρ)
- How consistently two rankings agree, from −1 to 1. A 0 means no relationship and a 1 means the same order.
- EPSG:2263
- The coordinate system used for all calculations: NAD83 New York State Plane, Long Island zone, in US feet. Distances like "5 ft" are measured in it.
- Vector tiles / PMTiles
- How the map delivers a million building shapes quickly: the data is cut into small tiles in one file, and the browser downloads only the tiles you're looking at.
Limitations
The stormwater maps are a model. They don't capture clogged catch basins, private drains, or sewage backing up through a building's own plumbing, and those are some of the most common causes of basement flooding. A gray building can still flood.
The basement flag marks where basement apartments are likely, not where they are. Lot data is also shared, so every building on a tax lot gets that lot's building class and basement type.
The FEMA map is preliminary. The 2015 map is the best one available, but it isn't the one in legal effect.
311 measures reporting as much as flooding. Some neighborhoods call more than others, and sewer backups happen outside storms too, which is why I look at storm days separately.
And to be clear, this isn't a flood determination. For insurance or building decisions, use FEMA's official map and talk to a licensed professional.
Reproducing it
The pipeline is Python (GeoPandas, Shapely 2, pyarrow) and runs end to end in about four minutes. Each step writes GeoParquet, so later steps re-run quickly.
python3 -m venv .venv && .venv/bin/pip install -r requirements.txt && .venv/bin/pip install -e .
source .venv/bin/activate
python -m flood_risk.download    # FEMA vector, NTAs, tracts, 311
python -m flood_risk             # ingest → clean → join → analyze
python -m flood_risk figures     # static charts
python -m flood_risk web         # vector tiles for this map
The full method, sensitivity checks and data inventory are in the project's docs/methodology.md
and docs/data_inventory.md.